The project is currently in the pilot phase, so some options may not be available. Share your feedback to help us improve.
Climate Change: Migration Economics
CliC:ME
Model validation
Content
Overview
Backcasting
References
Explore the dashboard
Overview
The validation of the model includes two steps, in which we verify the performance of the model to generate out-of-sample projections of international migration flows.
Backcasting
First, we use an older version of the model, published in Burzynski et al. (2020), to verify if the class of the quantitative theoretical models provides a reasonable tool for analysing and projecting migration flows. Importantly, the key differences between the current model and the backcasted model of Burzynski et al. (2020) are: the spatial resolution of macroeconomic analysis (countries versus pixels), the structure of the economy (two versus three sectors) and the structure of population (six versus twenty-six individual type groups). The way of modelling migration decisions is identical to the methodological perspective — using a random utility maximization model that leads to logit equations for migration probabilities. In that sense, the current pixelized version of the model is intended to offer even better out-of-sample performance, as it includes far more parameters of migration costs and more detailed spatial resolution.
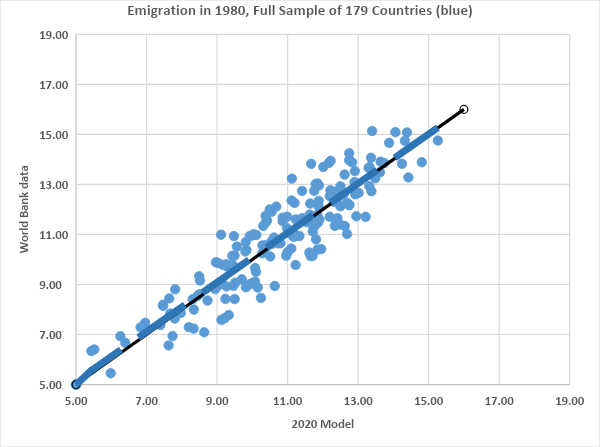
The next figure presents the comparison between the out-of-sample backward projection of international migration flows from the Burzynski et al. (2020) model. The simulation was performed for the year 1980 (the model is calibrated for 2010, and has a 30-year modelling period) for the sample of 179 countries.

On the horizontal axis, we plot the total country-specific number of emigrants, while on the vertical axis we show the total number of emigrants aggregated in the World Bank migration data. The blue dots represent all the countries in the world. The black line is the 45-degree line that corresponds to a perfect out-of-sample fit of the model. The long-dashed blue line illustrates the trend line between model and data numbers for all the countries. The equation of the fitted line (no intercept assumed) and the values of R2 (not normalized) are indicated in bottom-left part of the figure.
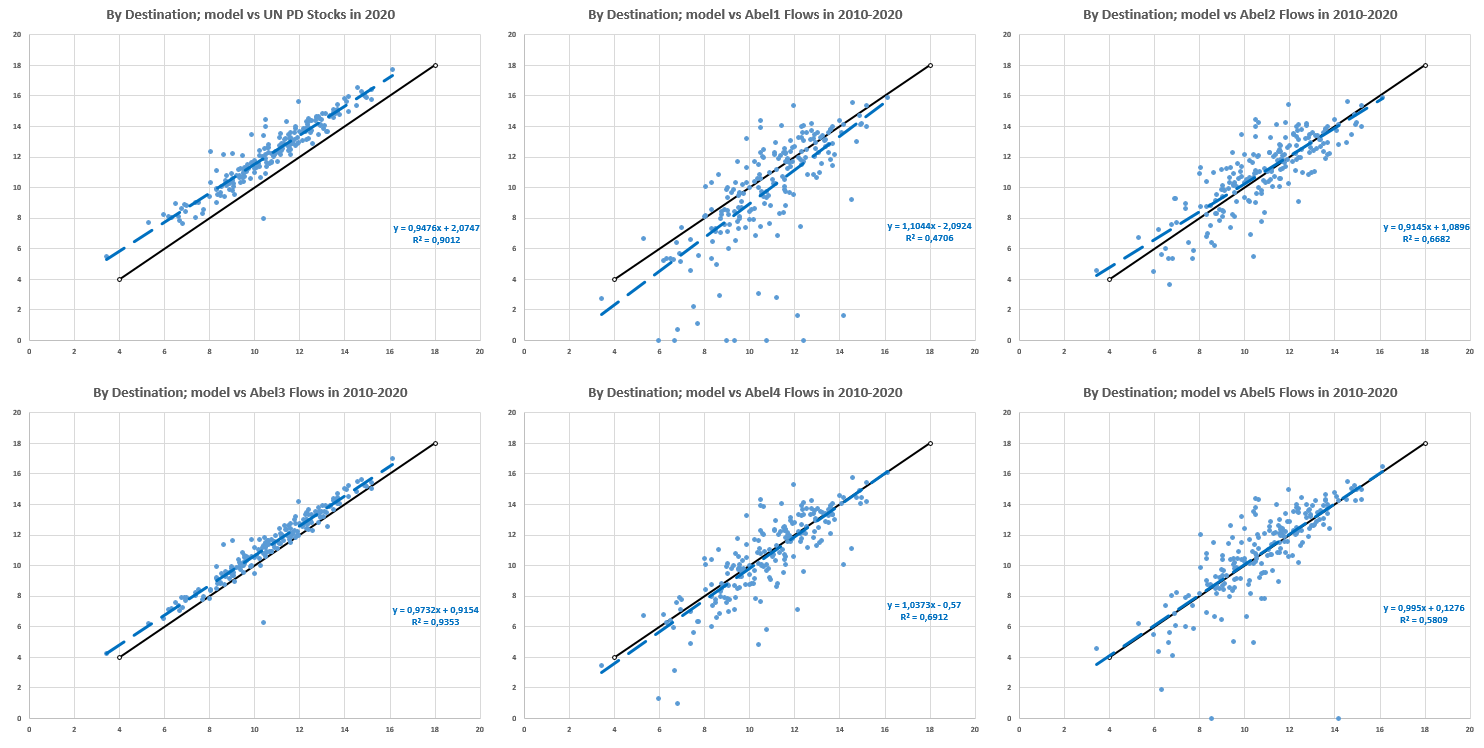
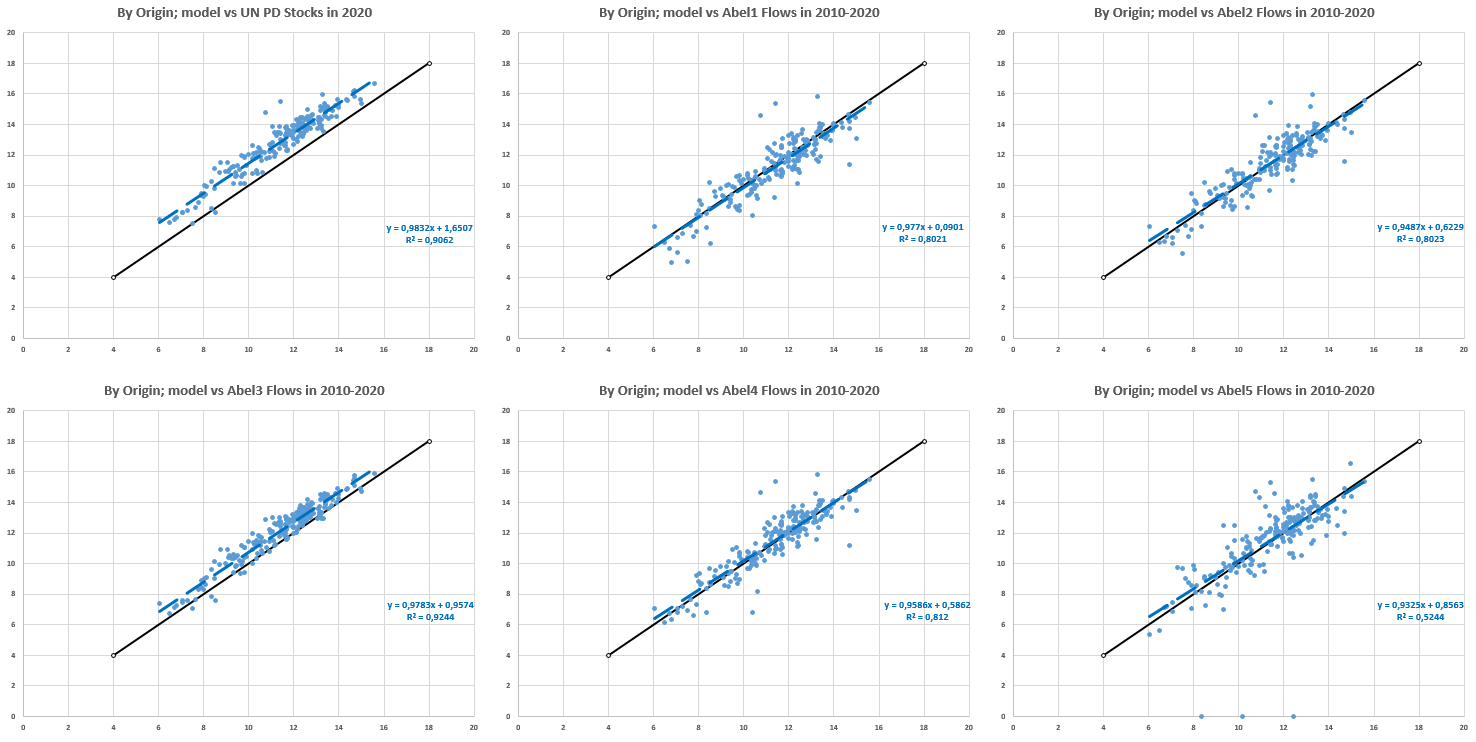
The next two sets of figures depict the forward-looking validation of the pixel model. Each of the figures presents the results in exactly the same way, except that in the first one, the data is aggregated by destinations (immigration flows), while in the second, we show the data by origins (emigration flows). As in the backcasting exercise, each panel of the figure presents the comparison of the model and observed data for international migration flows. Here, the flows correspond to the period 2010-2020. Importantly, the model values are challenged with six different data sources. First (top left panels of both figures), the comparison is relative to the stocks of migrants reported by the UN Population Division for the year 2020. In this case, we compare 10-year flows from the model with stock data, which shifts the points upwards over the 45-degree line, although the correlations are very promising.
We then use five different inputs of estimated migration flows data published by Abel and Cohen (2022). The top middle panels include ‘Stock differencing, drop negative values’ estimates, the top right panels include ‘Stock differencing, reverse negative values to counterflow’, the bottom left panels include ‘Migration rates method’, the bottom middle panels include ‘Demographic accounting, minimize migrant transitions (maximize stayers) - open accounting system’, while the bottom right panels include ‘Demographic accounting, minimize migrant transitions (maximize stayers) - closed accounting system’. The striking closeness of the pixel model’s projections to the ‘Migration rates method’ is no coincidence: the macroeconomic model works on projecting migration rates through endogenizing them with a multinomial logit model that depends on a complex interplay of socio-demographic, economic and climatic variables (most of them being endogenous in the model).

Both exercises give arguments for claiming that the model performs well enough to be used for out-of-sample estimates of international migration flows. At the least, it does not yield counter-intuitive results or outcomes that go against the broadly understood consensus about how migration flows could evolve in the near future. Importantly, a similar technology for modelling and projecting internal migration flows gives rise to the reasonable conjecture that the pixel model offers similarly good projections of regional and local migration movements. As long as users of this model realize that these projections do not include random or unpredictable future events (such as conflicts, changes in migration policies or health crises), the projections are trustworthy as an extrapolation (complex and convoluted) of the political and economic state of the world in 2010.

References
1.
Abel, G. J. and Cohen, J. E. (2022).
Bilateral international migration flow estimates updated and refined by sex. Scientific Data, 9(1):173.
2.
Burzynski, M., Deuster, C., and Docquier, F. (2020).
Geography of skills and global inequality. Journal of Development Economics, 142:102333.
Learn more
More topics from our Knowledge Base for further reading
Understanding the Spatial General Equilibrium Model
Gain comprehensive insights into the complex spatial general equilibrium model used to project significant climate change impacts on migration and the global economy.
How to navigate the Climate Migration Dashboard
Learn how to effectively use the Climate Migration Dashboard, including tips on accessing data, using visualization tools and customizing reports for your needs.
Our partners


Contact LISER
Luxembourg Institute of Socio-Economic
Research (LISER)
Maison des Sciences Humaines
11, Porte des Sciences
L-4366 Esch-sur-Alzette / Belval
E-mail: clicme@liser.lu
Tél.: (+352) 58 58 55 – 1
Technical problems?
The results published on this website by LISER have been generated using information, techniques, data, databases, algorithms, methodology, models, results, design, technology, material, inventions and/or software and any intellectual property rights (LISER’s background) as well as publicly available data, facts and information as detailed in our Knowledge Base. For the avoidance of doubt, LISER remains the sole owner of all LISER’s material, work, results and background.
The results of the project published by LISER on this website for dissemination of the knowledge, research and/or teaching purposes, may be accessed and used freely on an ‘AS IS’ basis, without any representation or warranty of any kind by LISER, either express or implied, including but not limited to any warranty or conditions of merchantability or fitness for any particular purpose.